


Introduction
Sensors have evolved from taking readings over time to taking readings over space and time. Understanding this trend and the resulting impacts are essential for innovators seeking to create value in the next wave of IoT products and services.
From Transactions to Interactions to Observations
The earliest form of data used for analytics described transactions. Examples of transactions include when an order is placed, inventory is replenished, or revenue is collected. The era of big data emerged when organizations began to harness data from interactions. Interactions make a record of decisions when humans interact with online applications. Examples of interactions include engaging on social media, watching a show through a streaming service, browsing the web, or playing a video game.
What drives data volume growth today is the proliferation of devices that capture observations. Observation data is more about observing humans and machines than recording the choices of humans. For example, sensors are able to monitor a person’s pulse, the flow of traffic at an intersection, drone traffic in the air, the temperature of a mechanical part, the location of goods as they move through the supply chain, the amount of energy consumption at a building, and so on. Sensors that observe humans and machines are synonymous with the Internet of Things (IoT), as the readings are available online for processing at the edge or cloud.
Real-time decisions informed by IoT data are increasingly critical in many industries and across many application areas. Quite often, the ability to make such decisions relies on the quick analysis of multiple data sources with vastly different attributes. The essential datasets upon which the analysis must be performed typically include growing volumes of streaming data that contain key events combined with historical data that provides context.
The capability to perform this analysis and generate real-time insights has many current uses and opens the door to innovative applications. Some examples of what is possible include:
- Smart cities that observe traffic and dynamically change the traffic light times to minimize congestion.
- Transportation firms optimize routes to reduce fuel costs and accelerate the speed of goods through the supply chain.
- Auto manufacturers monitor the health of the vehicle and make proactive recommendations to the owner to avoid mechanical failures.
From Readings Over Time to Readings Over Time & Space
The first generation of IoT data consisted of readings over time. A sensor that is capturing a reading like the temperature of a device would do so in metered time intervals, allowing monitoring for anomalies. The next generation of IoT provides readings over time and space. Sensors are increasingly taking a reading with stamps on the time and location of the thing. Most things are in motion: inventory, vehicles, planes, people, weather, energy, etc. Even things that are fixed in location, like crops where sensors take readings of soil moisture, require a longitude and latitude in order to send irrigation equipment to the right location when needed.
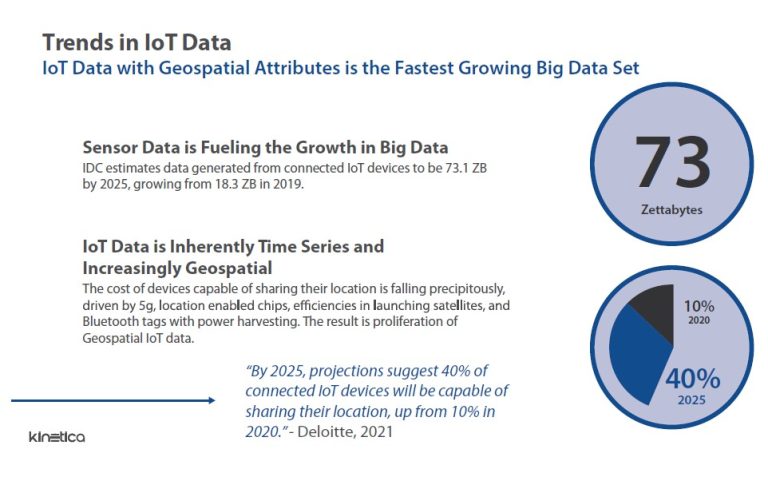
Such data is likely to become much more common since the cost of sensors and devices that generate geospatial data is falling rapidly with corresponding proliferation. The cost of location-enabled chips for cellular connectivity is expected to decline by 70% from 2017 to 2023. Costs of launching a satellite have fallen sharply over the past decade on a per-kilogram basis, meaning more data-collecting satellite launches over the next few years. The expansion of 5G networks is aiding in the collection of greater volumes of geospatial data. Bluetooth tags with integrated power harvesting are expected to drop in price by two-thirds. In fact, data from IoT devices and sensors is expected to explode over the next few years. IDC estimates data generated from connected IoT devices to be 73.1 ZB by 2025, growing from 18.3 ZB in 2019. Deloitte predicts that by 2025, 40% of connected IoT devices will be capable of sharing their location, up from 10% in 2020.
What’s needed?
The challenge becomes how does an organization make use of such data? Essentially, an organization using large volumes of streaming data with a geospatial aspect needs three capabilities to carry out analysis and derive insights. They include:
Ability to make real-time decisions: Most high-value IoT use cases require decisions to be made in real-time. For example, NORAD aggregates hundreds of radar feeds and needs to determine if an entity in the airways is a threat or not. Smart cities are alleviating congestion by adjusting the times and patterns of stoplights. Those determinations must be made in seconds, not hours because the opportunity is perishable.
Traditional analytic databases are optimized for transaction properties at the expense of data freshness. These databases lock down the tables while being loaded. For performance reasons, they also require indexes and summary tables to be rebuilt to reflect the new data, further adding to the latency profile. An important measure to consider when evaluating a real-time database is data latency. Data latency is the time from when data is produced to when it can be queried and is a function of how efficiently a database can sustain writes and the amount of overhead required to achieve acceptable performance. The other key measure is query latency. Query latency is the time it takes between submitting a query and returning an answer. Next-generation IoT databases enable simultaneous query and ingest. They also take advantage of new computing paradigms to remove the need for time-consuming hacks and tricks to overcome performance limitations.
Temporal and spatial joins: Traditional databases are optimized for joining explicit primary and foreign keys, such as customer_numbers, session_ids, and order_numbers. That breaks down when trying to join time and space data with other data to provide context. Geo-joins are used to bring the power of location to a query. For instance, how many drones came within 500 meters of an airplane? Examples of geo-joins include Intersect, Within a Distance, Completely Within, Closest, and many others. Temporal joins answer questions like, “What was the last stock price at the time of order?” Examples include Start, Finish, Meet, Right Overlap, As-of, Left Overlap, Contain, Intersection, and many others.
Ability to answer unknown questions: Patterns in data often change, making it hard to know all the questions in advance. For instance, cyber threats constantly evolve, so optimizing performance against known requirements isn’t sustainable when the requirements are constantly changing.
An organization must be able to create sophisticated ad-hoc queries and apply new analytics techniques
without impacting performance as data changes or opportunities arise. These capabilities must be
enabled without tedious and complex data engineering that ultimately delays insights.
Why legacy approaches fall short
Many traditional analysis methods, such as those based on data warehouses and data lakes, streaming technologies, or point solutions, fall short when it comes to performing real-time analysis of streaming data that has a geospatial component. In particular:
– Data warehouses and data lakes do not enable data analysis on streaming data within an acceptable latency profile. They incur two types of latency: data latency and query latency. Both add to delays that must be eliminated to take immediate actions based on real-time analytics.
Specifically, as noted above, data latency reflects the time from when data is produced to when it can be queried. If data is written to a data warehouse or data lake first and then queried, data latency is dependent on how efficiently a database can sustain writes. In situations such as the generation of real-time telemetry data, where new data is rapidly being produced, the longer it takes to get the data are written to the database for analysis, the more that data no longer reflects the current state of the system generating it.
further, query latency reflects the time it takes to execute a query and receive the results. While data warehouses and data lakes effectively handle large data volumes, they struggle to return queries that introduce temporal and spatial joins.
– Streaming technologies like Apache Kafka lack the ability to incorporate historical and contextual data. The design center of streaming technologies is a queue, where data is moved in real-time from one system to another. Since the data is not persisted, there is no accumulation of history or ability to join with other data. Further, they often have limited time-series analytics and no geospatial functions.
– Point solutions become too complex to manage and do not scale well. Organizations often try a do-it-yourself approach by stitching together streaming, columnar database, NoSQL, and geospatial applications like PostGIS or ESRI. Typically, the resultant solution becomes burdensome to manage and troubleshoot, and it is hard to enhance the solution or add new capabilities.
Critical elements of a technology solution
Such criteria and capabilities help define and determine what technology elements a solution must have to perform real-time analytics on streaming, historical, and geospatial data.
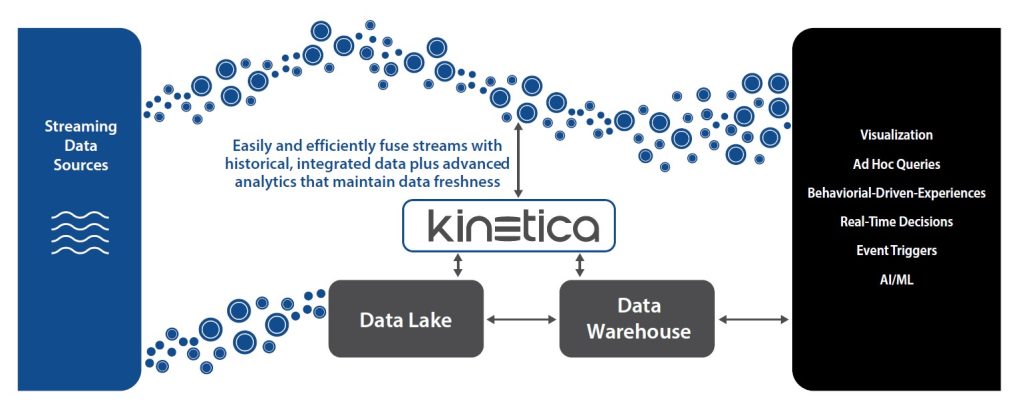
At the heart of any solution for this type of analysis and real-time decisions is a real-time analytic database that acts as a speed layer filling the gap between streaming and data warehouses/data lakes. The database must be able to rapidly ingest high-velocity data while simultaneously processing large-scale queries. A real-time analytic database lets organizations make the most out of real-time data by helping them to extract valuable information and trends from it as it is being ingested.
Also needed is the ability to do spatial-temporal analytics of today’s massive geospatial and time-series datasets. Assessing both the temporal and spatial dimensions of data adds significant complexity to the data analysis process. As such, many analytics solutions cannot perform this combined function. A solution that can perform spatial-temporal analysis offers benefits over purely spatial or time-series only analyses because it allows an organization to study things in motion.
The role of vectorized databases
Current generation databases use conventional CPUs that sequentially perform calculations. Even though they are “parallel” by distributing across multiple nodes, the bottleneck occurs at the processor level. Breakthroughs in database architectures have given rise to a new generation of databases that vectorize the calculations within the processor, acting as a force multiplier on performance. These order of magnitude performance improvements open the door to doing spatial and temporal joins across big data sets that simply were not possible with traditional massively parallel processing (MPP) databases. They were not designed to do real-time processing of data that require non-explicit joins on time and space dimensions.
More recently, organizations have begun to speed analysis by employing GPUs or CPUs that use Intel’s Advanced Vector Extensions (AVX) so that operations can be applied to all the data in a database in parallel. As such, databases based on vector processing are gaining wide popularity in that they efficiently use modern chip architectures on commodity hardware and in the cloud to optimize analytic performance.
Vector instructions can include mathematics, comparisons, data conversions, and bit functions. As such, vector processing exploits the relational database model of rows and columns. This also means columnar tables fit well into vector processing.
What vectorized databases do best is stepping through a large block of memory with a list of instructions. In this way, vectorized databases are ideal for processing data with space and time components. Why? Geospatial indexes can become very complex, as systems typically partition data into separate buckets for different geospatial resolutions. A GPU or Vectorized CPU can compute massive amounts of geospatial and time-series data directly with ease. Additionally, with vectorized databases, aggregations, predicate joins, and windowing functions all operate far more efficiently.
Teaming with a technology partner
Putting together the elements needed to make real-time decisions on streaming data that also has a geo-location aspect can be a challenging task. Most organizations do not have the staffing hours, resources, or expertise to bring everything together and optimize the performance of the solution.
That is why many are turning to technology partners for help. One such partner with deep industry knowledge and expertise in this area is Kinetica. It offers an analytic database for fusing data across streams and data lakes to unlock value from spatial and temporal data at scale and speed.
Its solution supports real-time analytics that combines live streaming data with stateful relational data, all in one database, and without the need to tie together a collection of piecemeal technologies.
This capability overcomes the limitation other data systems have when it comes to real-time analysis on moving data. In particular, most systems aren’t designed to handle the high-cardinality joins and the constant aggregation and re-aggregation as new data changes. Stream processors lack sophistication. Batch processing in data warehouses is too slow and only gives an after-the-fact picture of what has happened. Assembling a variety of specialized technologies to build real-time systems soon becomes complex. Kinetica brings context to streaming data, something that has always been difficult with these other approaches.
Kinetica also offers geospatial analytics by natively supporting points, shapes, tracks, and labels. There are over 130 geospatial functions that are available through SQL or the REST API. Functions include tools to filter data by area, by track, or custom shape and perform geospatial joins.
The biggest differentiator is Kinetica’s native vectorization capabilities. Kinetica was designed from the ground up to leverage the parallel compute capabilities of GPUs and modern vectorized CPUs. This introduces a new level of brute-force compute power that enables faster and more flexible querying across large and streaming datasets.
In benchmark tests using identical CPU-only hardware running TPC-DS SF-1000, Kinetica analytic performance was 6x faster than Apache Spark 3 and ClickHouse 21, 8x faster than Databricks 9.1 LTS (Photon), and 10x faster than Snowflake.
Kinetica’s native vectorization delivers order of magnitude performance improvements on a smaller compute footprint and removes the complex data engineering required by other databases to make up for their inefficiencies. For example:
- A large U.S. financial institution moved from a 700-node spark cluster running queries in hours to seconds on 16 nodes of Kinetica.
- A top U.S. retailer consolidated 100 nodes of Cassandra (NoSQL) and Spark into eight Kinetica nodes.
- A large pharmaceutical company achieved identical performance with an 88-node Impala cluster and a 6-node Kinetica Intel cluster in Azure.
Kinetica deployment options include software to run on-premises, in the cloud, or as-a-service in the cloud. Kinetica is used in industries including ad tech, automotive, financial services, energy, healthcare, retail, telecommunications, utilities, public sector, and more.